A $4M Warehouse Turnaround at a 35,000-Order-a-Day E-Commerce Fulfillment Center
At a glance
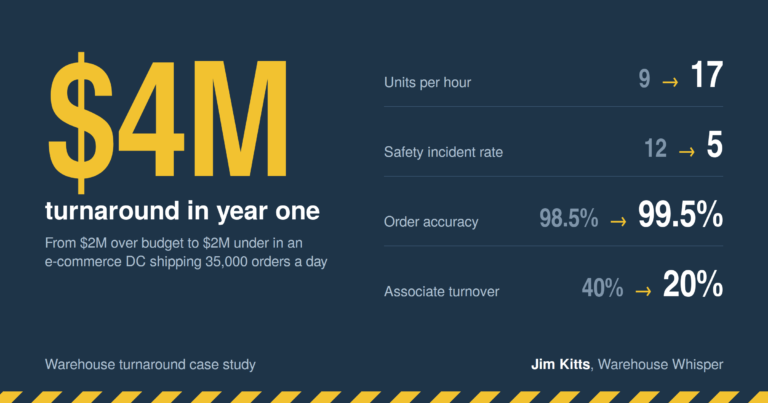
- Site: Staples e-commerce fulfillment center, 35,000 orders a day, next-day delivery on every order
- Starting point: $2M unfavorable to budget, one of the worst safety records in the network, and a culture in trouble
- Year one: finished $2M favorable to budget, a $4M warehouse turnaround
- Productivity: 9 → 17 units per hour, nearly double
- Over three years: cost per unit down 12%
The situation
When I took over the building, the P&L was running $2M in the red against budget. The numbers were only part of it. You could see the problem walking the floor: the building was a mess. In my experience, a disorganized building is never just a housekeeping issue. It’s a culture signal. It tells you standards aren’t being set, followed, or enforced, and that leadership has stopped expecting better.
The metrics confirmed it. The safety incident rate was 12, among the worst in the network. Accuracy sat at 98.5%, which sounds acceptable until you realize it means 1 in every 67 orders had an error. Cargo loss, meaning product we said we shipped but didn’t, was costing money and customer trust. Damages ran 10 basis points of sales. Turnover was 40%, and associate engagement was low.
What I did
I didn’t start with technology or capital. I started with leadership and standards.
- Rebuilt the leadership team, putting people in place who would own their areas and hold the line
- Rewrote the SOPs and enforced compliance so every shift ran the same way
- Made safety the first priority, because a building that doesn’t take care of its people won’t take care of its customers
- Accepted higher turnover early on. Resetting standards meant some people wouldn’t make the transition. Turnover went up before it came down, and that was part of the fix, not a side effect.
The results
| Metric | Before | After |
|---|---|---|
| P&L vs. budget | $2M unfavorable | $2M favorable (year one) |
| Productivity | 9 UPH | 17 UPH |
| Safety incident rate | 12 | 5 |
| Accuracy | 98.5% | 99.5% (errors cut by two-thirds) |
| Damages (internal and external) | 10 bps of sales | 4 bps |
| Associate turnover | 40% | 20% (after three years) |
| Cost per unit | — | Down 12% over three years |
Throughout, the building sustained next-day delivery on every order, and associate pulse survey results improved significantly.
What this means for your building
Most struggling operations don’t have a technology problem. They have a standards and leadership problem that shows up in the numbers. The fix starts with seeing the building clearly, both in the data and on the floor, and then putting the right people and processes in place to hold the gains.
If your building keeps missing plan and you’re not sure why, start here.